Your Autumn Journey Needs This Foliage Map
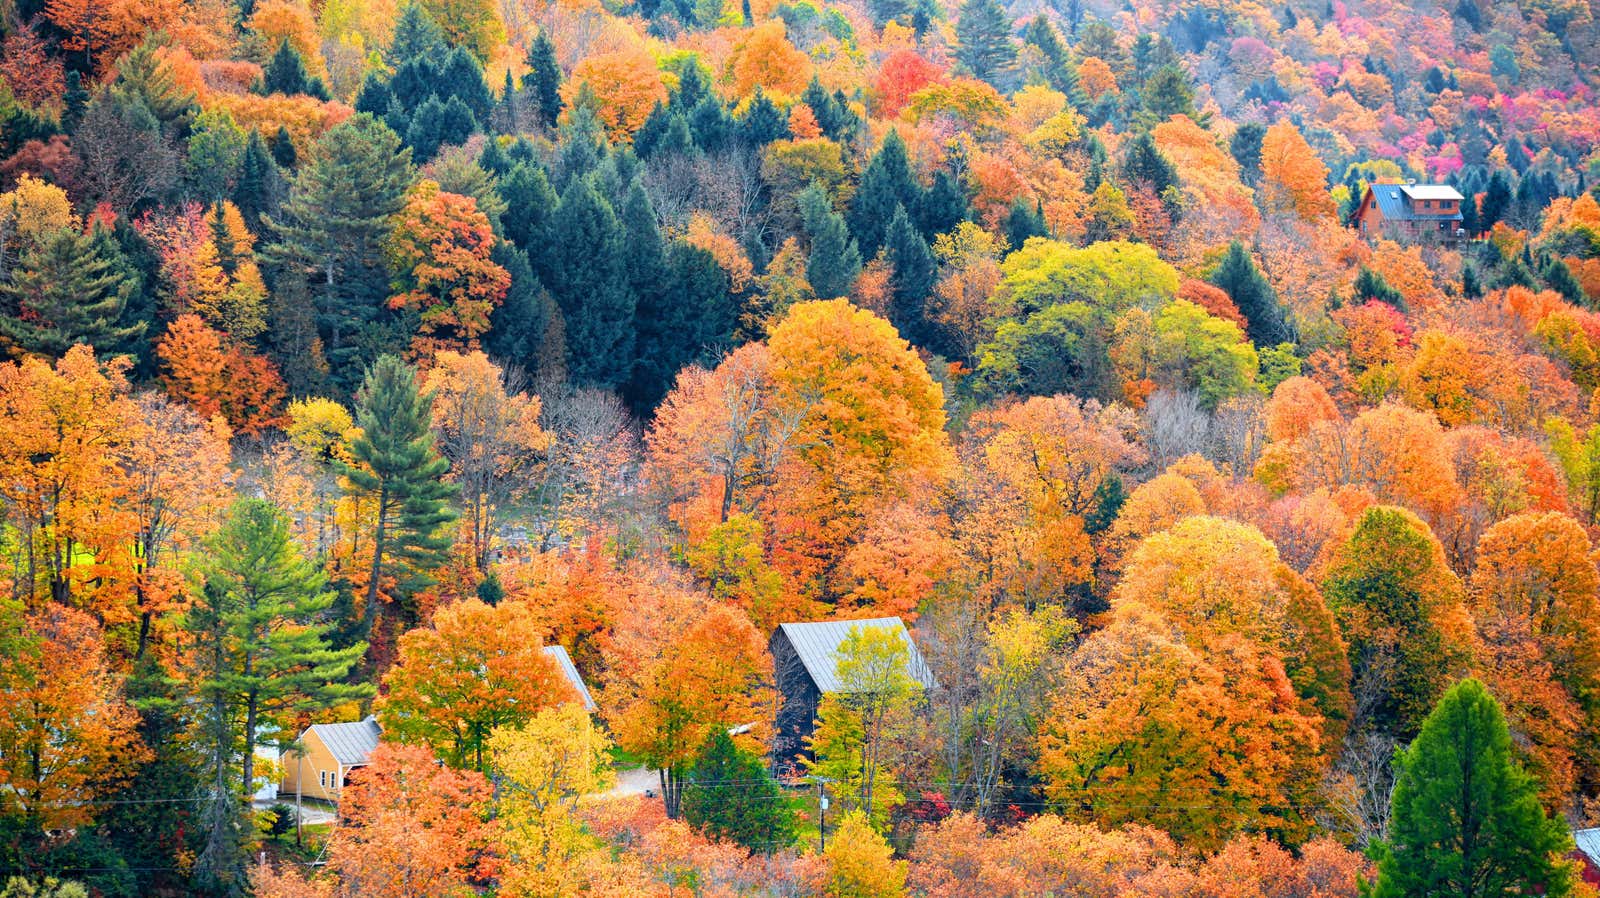
For a few weeks each year, nature puts on a show in certain parts of the country. Of course, autumn means a long, dark winter lies ahead of us, but before things get too gloomy, some regions might enjoy watching their leaves change color.
And while there are no guarantees when it comes to weather, data from previous fall can be used to help predict when foliage will peak. This information is available as a map, and the map for 2022 has just been released. Here’s what to know about this year’s fall foliage, especially if you’re planning a trip to see it.
How to Use the 2022 Fall Foliage Map
As in previous years, David Angotti, statistician and founder of the SmokyMountains.com website, is behind the 2022 fall foliage map.
Using the map is pretty simple: just select a date using the slider at the bottom of the map and the colors will indicate where the foliage peaks for that particular week. For example, if you select September 5th, you will see the leaf forecast for the week of September 5th to 11th.
The map uses an algorithm that analyzes several million data points to provide a county-by-county prediction of when the leaf change will peak. Some of these data points include:
- NOAA Historical Temperatures
- NOAA historical rainfall
- NOAA temperature forecast
- NOAA Precipitation Forecast
- Historical leaf growth trends
- Trends in Peak Observations
- Custom reports
So, how do you get into the fall foliage prediction business? “In 2013, potential visitors to the Smoky Mountain region began asking us questions about when the leaves would be at their brightest,” Angotti tells Lifehacker via email. “Based on these questions, we built the first version of the Autumn Leaves Map and continually improved it every year.”